
The infographic you have after the jump is nothing more than the Hunch site's attempt to illustrate the differences that exist between users who use a Mac and those who prefer a PC.
To make the infographic, Hunch surveyed some 700.000 people and after analyzing the responses of each user, a series of mails were obtained (demographic data, culinary tastes, aesthetics, personality,…) among the users of both platforms.
You have the complete infographic after the jump: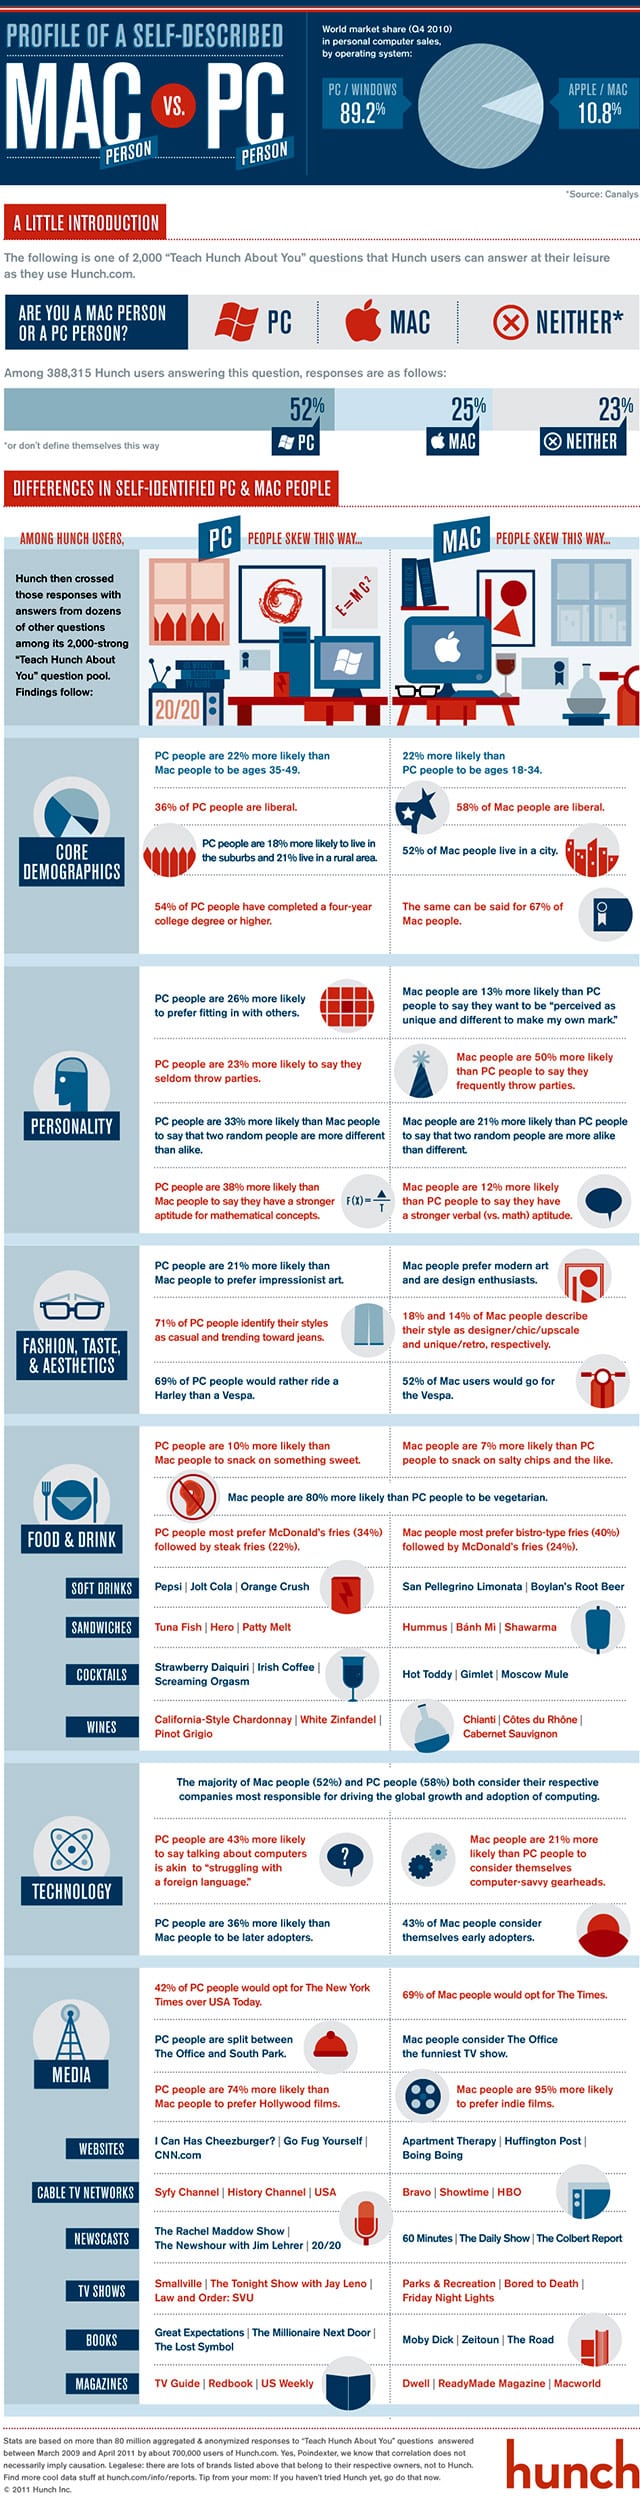
Source: Mashable