
All machines need their Care and maintenance so that they always perform at one hundred percent of their capacity. But many times we forget about it. We don't usually empty the vacuum cleaner bag until we realize it's not sucking, or we never look at the car's tire pressure until there's a problem.
Our Mac is still a machine like any other. We have a great utility called Activity Monitor, and we only resort to it when our computer is slow or stuck. Every now and then we should keep an eye on it.
The Activity Monitor on your Mac is one of those tools that we never use and that we should do from time to time. You don't have to be a computer expert to take a look at it every now and then and see that all the operation of your Mac is correct.
Open it without fear and see the information it gives you. Go to Launchpad, Others, Activity Monitor and you will be able to observe in real time what your computer is doing.
Categories
Once open you will see five different categories. Each of them is a screen where it shows you all the detailed information of the category in question.
- CPU: You can see what processes your Mac's processor is running.
- Conference proceedings: Shows you which applications are using RAM and how much of it. Important if you only have 8 GB.
- Energy: Essential if you use a MacBook. Control which apps use the most power so you can better manage battery life. On an iMac it is irrelevant.
- Disc: Important also if you don't have enough capacity.
- Red: Monitors the network. Look at it from time to time so that you don't get any surprises, especially if you go bare-chested without antivirus.
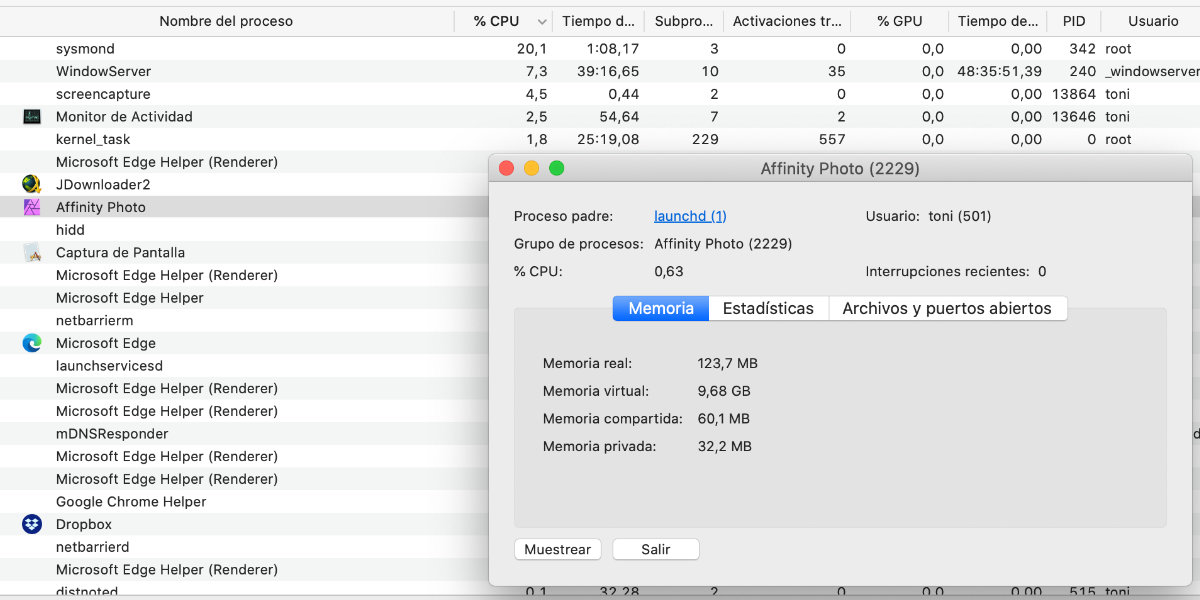
It offers you a lot of information about each specific process.
What data does it show us
As you change to each of the screens listed above, it shows you a data table, which can be sorted by columns. Right click on a column header and you can view them however you like.
At the bottom it presents some very interesting graphics depending on what category you are in. For example, on the CPU you can see how "burdened" your processor is in real time. In energy, it is important to see the consumption especially if you are pulling the battery.
You can have more information of each process specifically, in case you think that its operation is not adequate. In any of the tables, double click on the specific activity and it will show you a new window with a lot of information about this application.
It shows you the main process, how much percent of CPU are you using, how much RAM, statistics, files y open ports. If you see something you don't like, you can stop the activity by pressing the stop cross on the toolbar.
Having seen this, it should not scare you to look at the Activity Monitor from time to time and see that everything is more or less normal. Can you detect any process that it is consuming more resources than it should, and trying to remedy it.